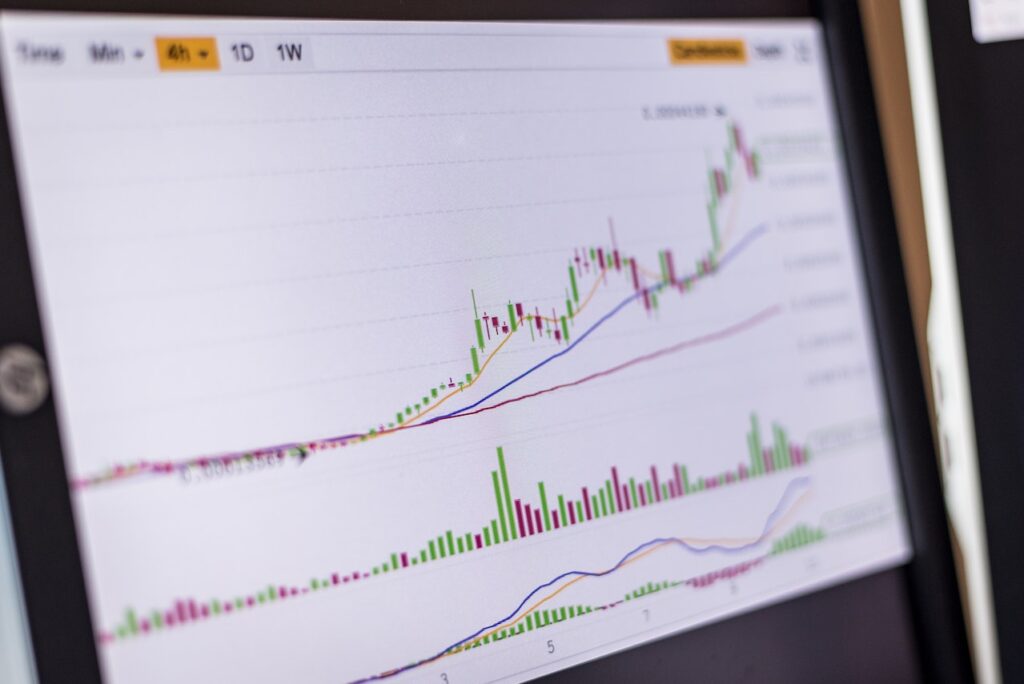
A bullish fractal is formed when the lowest low point is flanked by two higher low points. The bullish fractal is often used on currency pairs, but it can also be used on other assets. It can also confirm a trend reversal. The Alligator indicator can be used to confirm this scenario.
Chart patterns
In the forex market, one of the most powerful trading strategies is using chart patterns. These patterns provide traders with a constant stream of trading opportunities. Whether you’re new to forex or have years of experience, you can use chart patterns to make some serious money. These strategies are also based on the principle of timing. For example, traders can place a buy stop order during a consolidation period. This will ensure that they ride the bull trend when it resumes.
Traders can use chart patterns to find out the direction of the market. Identifying the current market condition is essential to finding the right time to trade. For example, a head and shoulders chart pattern might be a good trade to enter if volatility is contracting. This indicates that the market may be ready to expand again.
Support and resistance levels
Support and resistance levels are an important part of any forex trading strategy. These are zones where price may bounce in the opposite direction of the current trend. They represent the point at which the interests of various players in the market intersect. To understand how they work, traders should be familiar with the patterns that have formed in the past. As such, it is important to recognize them when they appear on a chart. Here are some examples:
Support and resistance levels are used by many traders to help them determine when to enter or exit a trade. Some traders place their stop loss orders at these levels. Others use trading channels, wherein they buy when an asset hits a support level and sell when it hits a resistance level.
Keltner channel
A Keltner channel is a trading pattern that has the ability to signal potential breakouts and trend reversals. Keltner channels are based on a 350-day exponential moving average of closing prices, and the upper and lower borders are calculated as seven and three times the 350-day ATR, respectively. A trader who uses a Keltner channel as a trading strategy should be aware of the support and resistance levels in order to choose the best entry and exit point.
The Keltner channel is a lagging indicator that helps identify the trend and makes it easier for traders to trade within the trend. In addition, it can help traders determine the direction of the trend based on the slope of the channel, which is measured on the daily chart.
Counter-trend strategies
Regardless of market conditions, the best counter-trend forex trading strategies combine price action analysis and popular indicators. These strategies are highly profitable in trading ranges and channels, but they do come with some risks. New traders should be cautious and back-test their strategy in a demo account first. They should also avoid trading on impulse, as a single mistake can wipe out their entire trading capital. Moreover, they should always keep in mind that different market conditions require different risk management approaches.
There are two primary counter-trend strategies. The first involves buying when the price is below a high and selling when it is above it. In other words, the first method is based on the assumption that the market will retrace its high. The second method is based on the assumption that the market will reverse its trend and go down instead of up.
Inside bar strategy
The Inside bar strategy is a popular strategy for day trading. The main idea is to place a stop loss order at the lower end of the candlestick. This way, you will be able to protect your profits if price reverses. However, you need to keep your Stop-Loss small. This is because Inside Bars have little volatility, and you must be careful not to get stopped out too early.
To maximize your profits using the Inside bar strategy for Forex trading, you must first understand its limitations. While it can be used on the daily Forex charts, it is best to start by focusing on the 240 minute charts. This will allow you to master the strategy quickly.


Facebook Comments