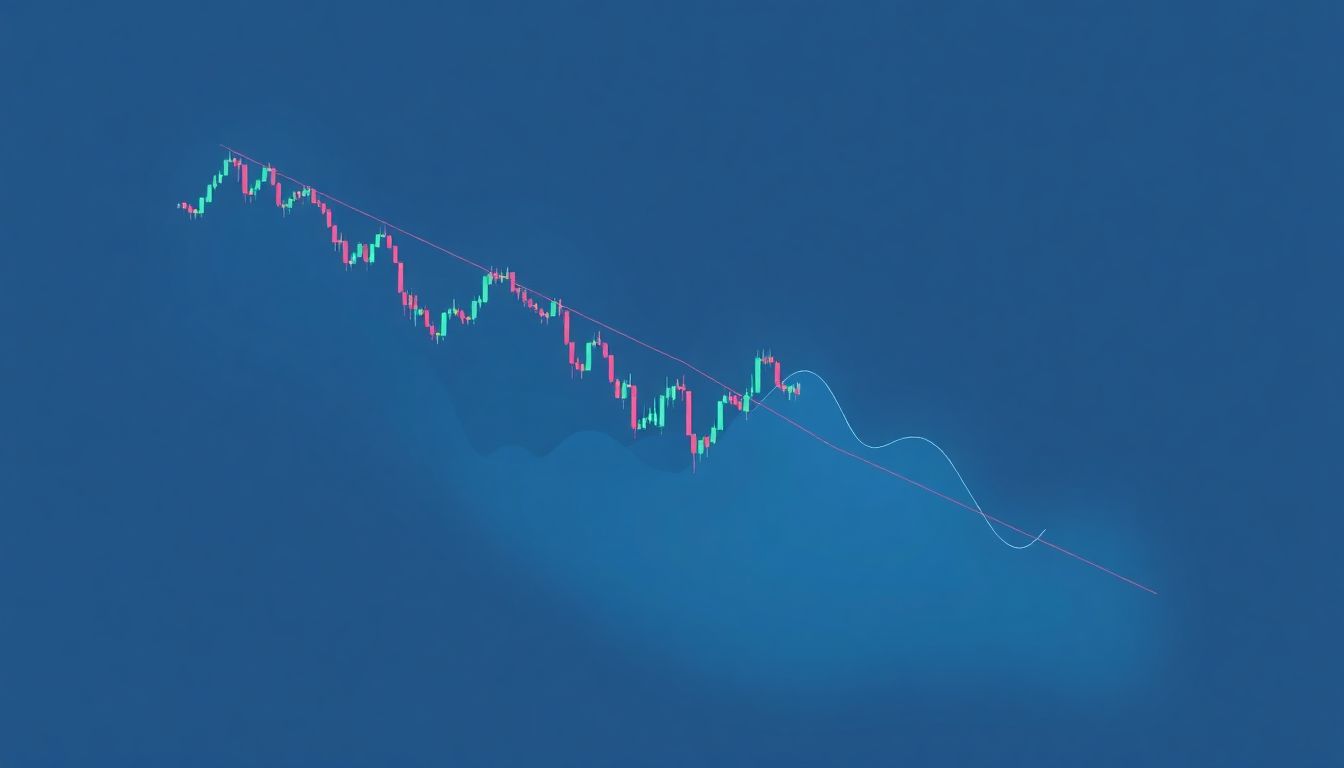
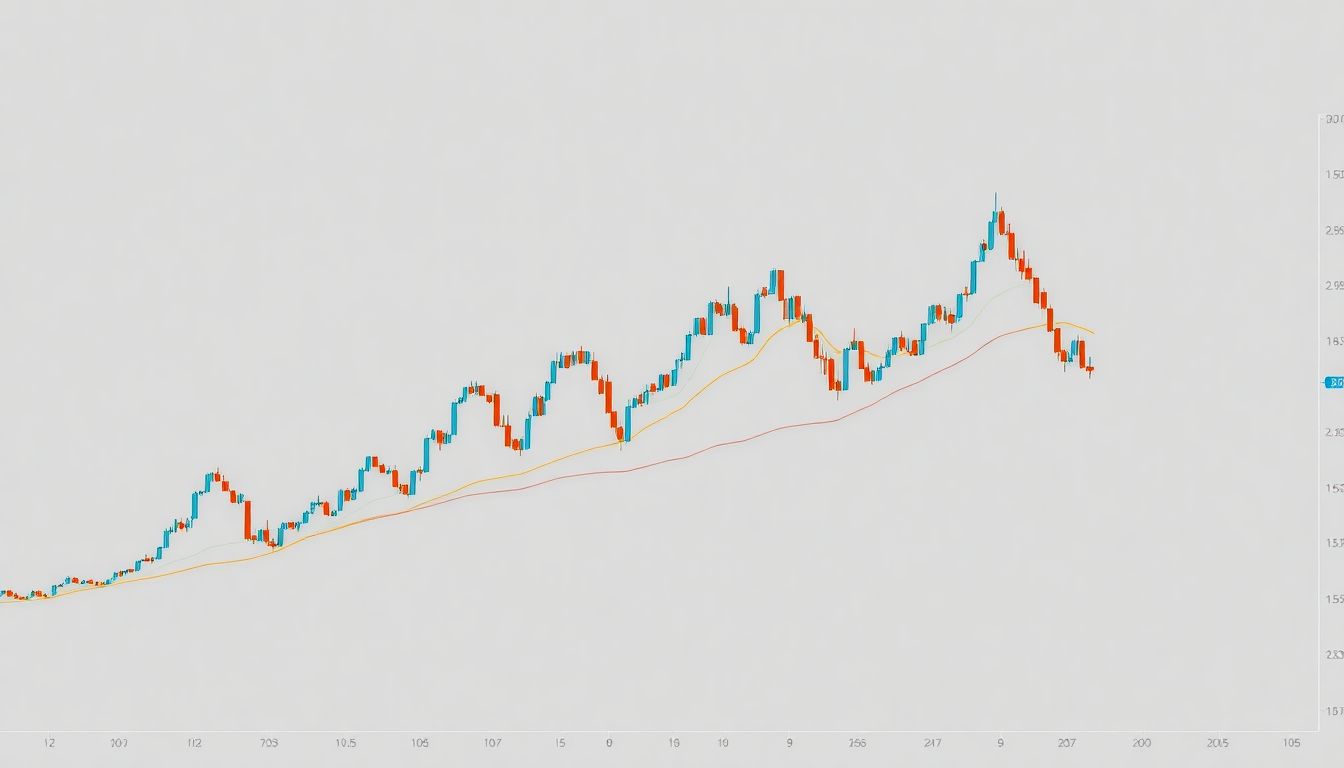
Did you know that the forex market handles over $6 trillion in transactions every day? This enormous volume makes it essential for traders to understand how to read forex charts effectively. Forex charts provide a visual representation of currency price movements, allowing traders to make informed decisions. This guide aims to equip beginners with the key patterns and skills needed to interpret these important tools.
Understanding Candlestick Charts: The Foundation of Forex Analysis
Candlestick charts are the most popular choice among forex traders. They provide more information than simple line charts by displaying price movements over a specific time period. Each candlestick shows the open, high, low, and close prices, making it easier to gauge market sentiment.
- Bullish Candles: Indicate price increases and are shown in green or white.
- Bearish Candles: Indicate price decreases and are shown in red or black.
- Wicks and Bodies: The body represents the opening and closing prices, while the wicks show the highest and lowest prices during that time.
Practical Exercise: Analyzing a Real-World Example
Try analyzing a candlestick chart of a popular currency pair, like EUR/USD. Look at how the candles form patterns and consider what these patterns might suggest about future price movements.
Identifying Trendlines: Spotting Market Direction
Trendlines are crucial in technical analysis as they help traders spot market direction. They indicate whether the market is in an upward, downward, or sideways trend.
How to Draw Trendlines Accurately
- Locate at least two prominent peaks or troughs.
- Draw a line connecting these points.
- Extend the line to see where it intersects with future prices.
Types of Trendlines
- Upward Trendline: Formed by connecting rising lows.
- Downward Trendline: Formed by connecting falling highs.
- Horizontal Trendline: Indicates a period of consolidation where prices move sideways.
Recognizing Support and Resistance Levels: Key Price Barriers
Support and resistance levels are significant price points that prevent further movement in either direction.
- Support Levels: Are price points where buying interest is strong enough to overcome selling pressure.
- Resistance Levels: Are price points where selling interest is strong enough to overcome buying pressure.
How to Identify Support and Resistance Levels
- Look for price peaks and troughs on the chart.
- Use horizontal lines to mark these points.
Trading Strategies
- Breakouts: When the price moves above a resistance level, it could signal a buying opportunity.
- Bounces: When the price respects a support level, it might indicate a good point to enter a long position.
Mastering Chart Patterns: Unveiling Predictable Price Movements
Chart patterns help traders recognize potential price movements. Here are three important patterns:
Head and Shoulders Pattern
This pattern indicates a potential reversal. It consists of three peaks: a higher peak (head) between two lower peaks (shoulders). Traders often look for a confirmation of the pattern before entering trades.
Double Top/Bottom Patterns
These patterns signal potential reversals. A double top occurs after an upward trend, showing two peaks at approximately the same price. A double bottom is the opposite, forming two troughs. Understanding how to spot these can lead to successful trades.
Triangles
Triangles indicate consolidation and can lead to breakouts. There are three types: ascending, descending, and symmetrical triangles. Traders monitor these patterns closely for potential price moves.
For a deeper understanding of chart patterns, check out “Technical Analysis of the Financial Markets” by John Murphy.
Using Moving Averages: Smoothing Price Action for Clarity
Moving averages help smooth price action and provide clearer signals. The most common types are:
- Simple Moving Average (SMA)
- Exponential Moving Average (EMA)
- Weighted Moving Average (WMA)
Interpreting Moving Average Crossovers
- Golden Cross: Occurs when a short-term moving average crosses above a long-term moving average, signaling a potential buy.
- Death Cross: Happens when a short-term moving average crosses below a long-term moving average, signaling a potential sell.
Statistic: Historically, moving average crossovers have appeared in about 30% of trading days, presenting significant trading opportunities.
Conclusion: Charting Your Course to Forex Success
Understanding forex charts is vital for trading success. Key patterns such as candlesticks, trendlines, support and resistance levels, chart patterns, and moving averages are essential tools for interpreting market movements.
To get started, practice analyzing different charts and identifying these patterns. Take action by engaging with forex communities, using demo accounts, and exploring advanced forex strategies to deepen your knowledge. The path to mastering forex trading begins with your commitment to learning and practicing chart analysis.


Facebook Comments