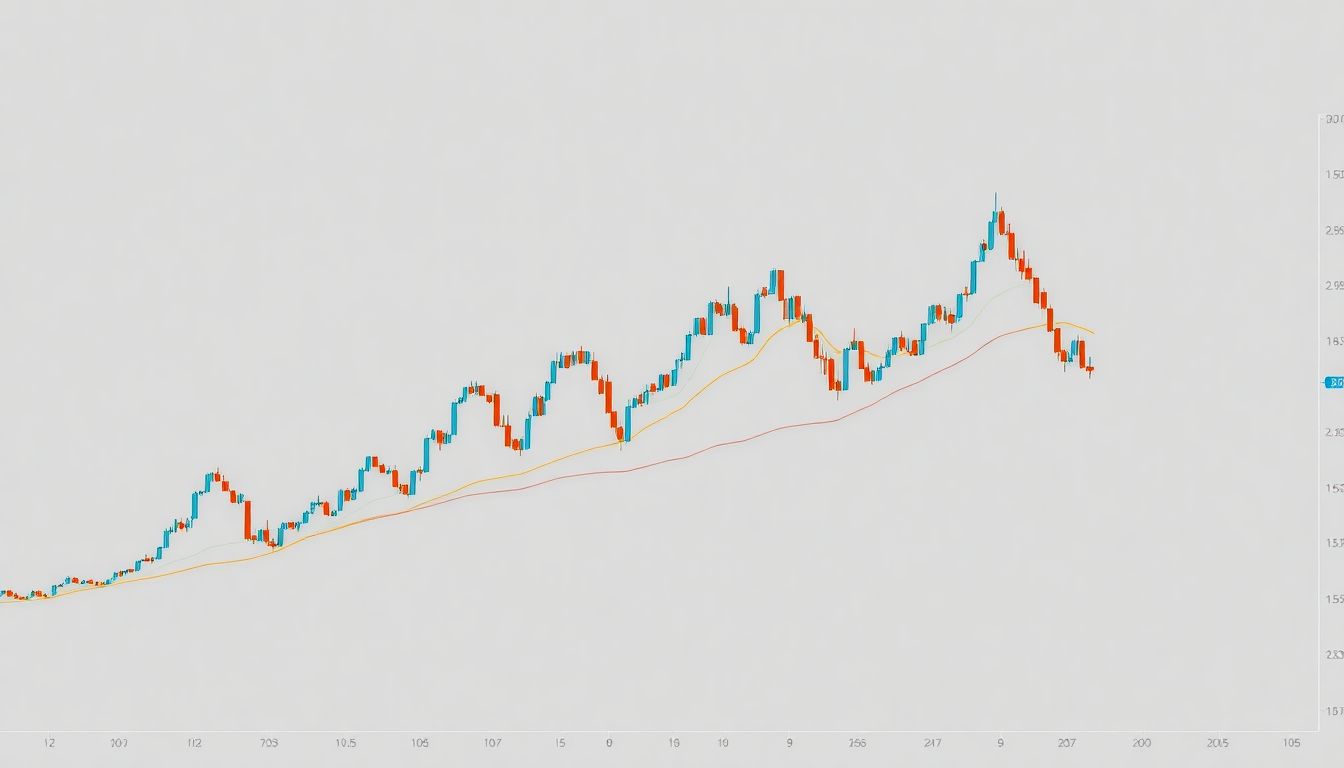
There are two basic types of bullish candlestick: the bullish and bearish. A bullish candlestick will be green while a bearish candlestick will be red. These two types of candles will be different in height, and the height of one will indicate which side is winning the trading session. When the bullish candlestick is green, it means that the bulls won the trading session. If the candlestick is red, then the bears won the session.
Morning star
A morning star bullish candlestick is a good indicator that a stock is about to turn around. It can occur when a stock makes a tall black candle, gaps below the prior body, and closes above the high of the first candle. This pattern indicates a change of trend, and it can also signal the bottom reversal.
It is a bullish candlestick because it reverses a downward price trend. In other words, the price drops into a morning star bullish candlestick, and then exits through its top. In addition, the bottom of the morning star appears to rest on a support area created by a tall black candle. However, this support may not be visible until after the candlestick has closed. In fact, it may be hidden to the left of the chart.
Another pattern that forms a morning star is the doji morning star. A doji morning star is a small candlestick that does not have wicks and shows indecision in the market. Nevertheless, traders should avoid trading solely on visual patterns. It is much better to base a trading strategy on other indicators or volume.
Inverted hammer
In the trading market, the Inverted Hammer candlestick can be used as a bullish reversal candlestick. This candlestick pattern can occur only when the previous trend has been down, with price making lower lows. This candlestick is an indication that the bulls have re-entered the market, putting buying pressure on the price.
The hammer candle represents a one-day bullish reversal. To form an inverted hammer, the open must be higher than the close. This means that the market is likely to reverse and end up at the bottom of a downtrend. This is the perfect time to enter a long trade. However, it is important to trade this type of candlestick with the proper support level. It tends to bounce off of trends, so a strong support level is essential to trade with it.
A good way to confirm an Inverted hammer is to look for a bullish candlestick in the next trading session. This pattern usually occurs at the end of a downtrend and can also occur in a range-bound market. The best way to confirm this pattern is to wait until the next trading session is in an uptrend and that the next day is a strong bullish candlestick.
Three White Soldiers
In a primary downtrend, the Three White Soldiers candlestick pattern can be seen as a retrace. If this pattern forms at a retracement level, it is a good sign for the bulls to take back control of the market. Once the retracement period has ended, the price will resume its downward trend.
Traders tend to buy stocks when they see the Three White Soldiers candlestick pattern. This is because traders expect a reversal of the trend and anticipate that it will end at a higher high. This pattern typically forms after a brief downswing. In order to identify this reversal pattern, traders must carefully analyze the candlesticks to look for signs of buying and selling pressure.
If you want to buy into a long position, the Three White Soldiers pattern is an excellent entry point. Alternatively, you can use it to exit a short position. When this pattern appears on a price chart, bears will liquidate their short positions. However, if this pattern is followed by a substantial move higher, this signals an overbought market.
Morning star pattern
A Morning Star is a common candlestick pattern, and its key component is the small, middle-body doji candle. A doji candle is a small candle with an obliquely-slanted wick on one side. Its presence in a candle pattern indicates that the bulls and bears are evenly balanced in the market. It signals the potential for a trend reversal.
The morning star candlestick represents a bullish reversal of a downward price trend. A large black candle gapping down in late July appears as a support area, and the morning star appears to rest on this support area. However, this support may not be visible until after the candlestick has closed. Therefore, traders should be aware of the presence of this support zone before entering a trade.
The morning star pattern is a powerful tool for predicting market trends. It can be useful for both technical and fundamental traders. The pattern is particularly useful for investors who are trying to buy on dips, and value investors who want to maximize profits while minimizing risk.


Facebook Comments