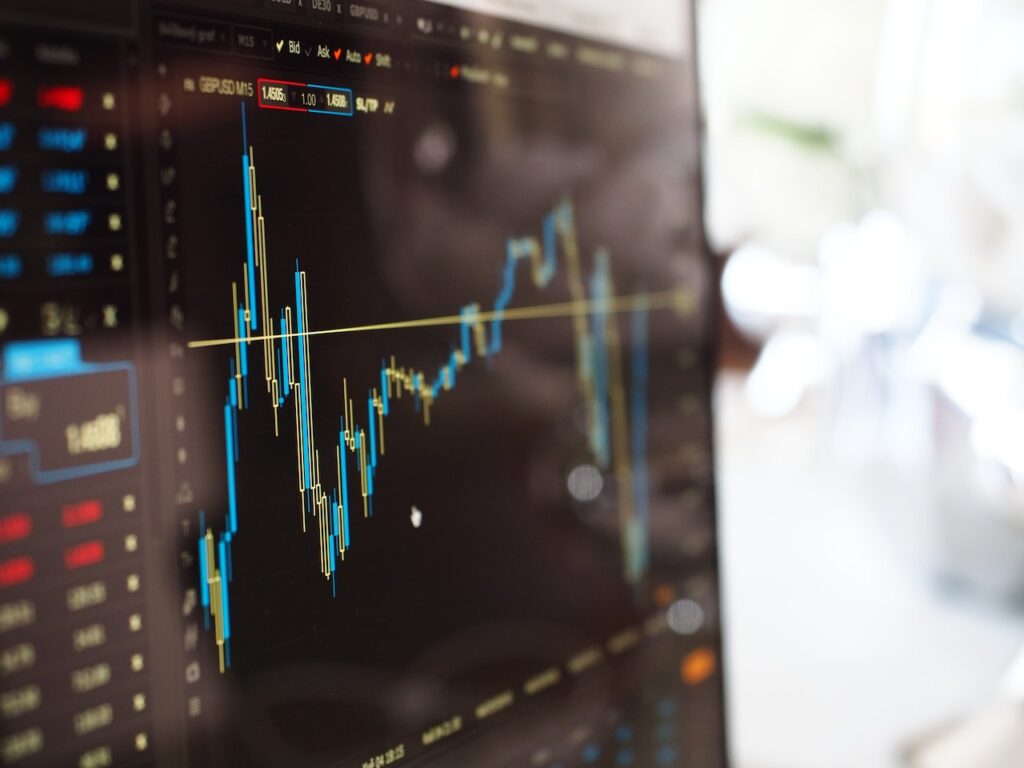
The stochastic oscillator is a momentum indicator that tracks the speed of price movement. It was created in the late 1950s by George Lane. This indicator measures price momentum and follows the price range over time. In a trending market, it can be useful in identifying trending prices. However, the Stochastic indicator can also be prone to false signals.
Stochastic oscillator is a momentum indicator
The Stochastic oscillator is a technical indicator that is used to determine price movements. It has two lines, the first displaying the current close relative to a user-defined high/low range, and the second displaying a simple moving average of the %K line. Its default settings are three and 14 periods. The oscillator is used in both trending and non-trending markets.
It is used in trading to identify important price levels ahead of time. It can also be used as a trend-following tool to anticipate price reactions and develop a trading strategy. While most traders use price charts and trend lines, those who want to be more active may want to incorporate a momentum indicator into their trading strategy.
The stochastic oscillator compares the high and low of a stock’s range and signals price movements before they happen. The default range is between zero and one hundred, and it has two lines: the slow oscillating %K line and the fast %K line.
It follows the speed of price momentum
The Stochastic indicator is a technical indicator that follows the speed of price movement. It is a good indicator to use if you want to identify overbought or oversold conditions. Overbought levels indicate that the market is overextended while oversold levels indicate that the market is undersold. In both cases, there is a high probability of a market going down or up.
The Stochastic Oscillator gives readings that range from zero to one hundred, with the %K line representing the last closing price and the %D line being a three-period simple moving average. This indicator works best in slow, broad trading ranges, and it can be used on most intraday time frames.
When the Stochastic Oscillator reaches an overbought or oversold zone, it indicates a reversal in price movement. In addition, a bullish divergence occurs when the price makes a lower low, and the Stochastic makes a higher high. This signals that the price is losing momentum and a bearish reversal may be imminent.
It can be used in trending markets
The stochastic indicator is a momentum indicator that is ideally suited for trending markets. It is also often used in combination with multiple moving averages (MA) to smooth out price action. Its logic is that a faster moving average crossing a slower moving average implies that the market is in an uptrend. If a stochastic buy signal occurs, traders can enter the market long, assuming that the price continues to climb.
The stochastic indicator oscillates between zero and one hundred. It also contains two distinct lines at twenty and 80. These lines are used to identify overbought and oversold conditions in a market. George Lane once said that prices follow momentum. When the %K line crosses the %D line, it signals that a trade is about to enter or exit.
The Stochastic indicator was first developed by Dr. George Lane in the 1950s as a way to measure price momentum. Lane believed that momentum changes often precede price changes, like a rocket liftoff. Lane also noted that stochastics can work in both trending and range markets.
It can produce false signals
While the Stochastic indicator can be very useful, it can also produce false signals, especially during volatile market conditions. These false signals can result in losing trades. Therefore, it is important to use a filter to filter out false signals, and only act on signals that go with the price trend.
A simple example of a false signal is when the indicator crosses over the overbought or oversold lines. When the oscillator crosses the 80 level, it is overbought. Conversely, when the stochastic indicator crosses over the 20 level, it is considered oversold. The stochastic indicator should never be used by itself. It is best used in conjunction with other tools, such as other indicators and trend lines. Using several stochastic iterations can improve the overall quality of your trades.
A stochastic oscillator can produce false signals in different circumstances, and the settings that you choose will affect how accurate it is. For example, a low stochastic will give a lot of false signals, while a high stochastic will produce very few false signals. Using higher settings will smooth out the stochastic and make it more reliable for making entries during a strong trend.


Facebook Comments