1. Introduction to Forex Charts and Technical Analysis
Welcome to our comprehensive guide on understanding forex charts and mastering technical analysis. In the fast-paced world of foreign exchange trading, it is vital to have a solid understanding of how to interpret forex charts to make informed trading decisions. Technical analysis is a powerful tool that allows traders to analyze market trends, patterns, and indicators to predict future price movements. By learning the ins and outs of forex charts and technical analysis, you will gain valuable insights into market behavior and enhance your trading skills. Whether you are a beginner or an experienced trader, this article will provide you with essential tips and techniques to navigate forex charts with confidence and precision. So, let’s dive in and unlock the secrets of successful technical analysis in forex trading.
Understanding Forex Charts: Tips for Technical Analysis
1. Introduction to Forex Charts and Technical Analysis
1.1 What are Forex Charts?
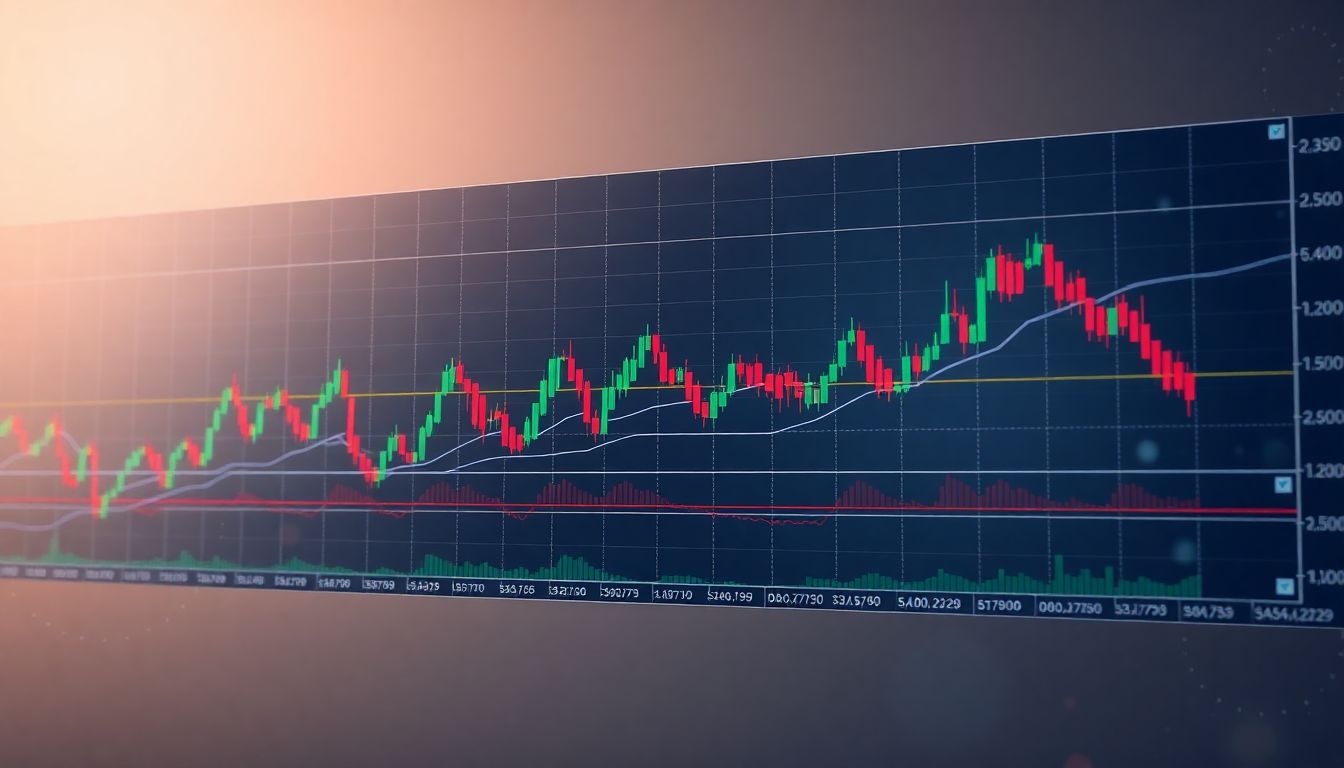
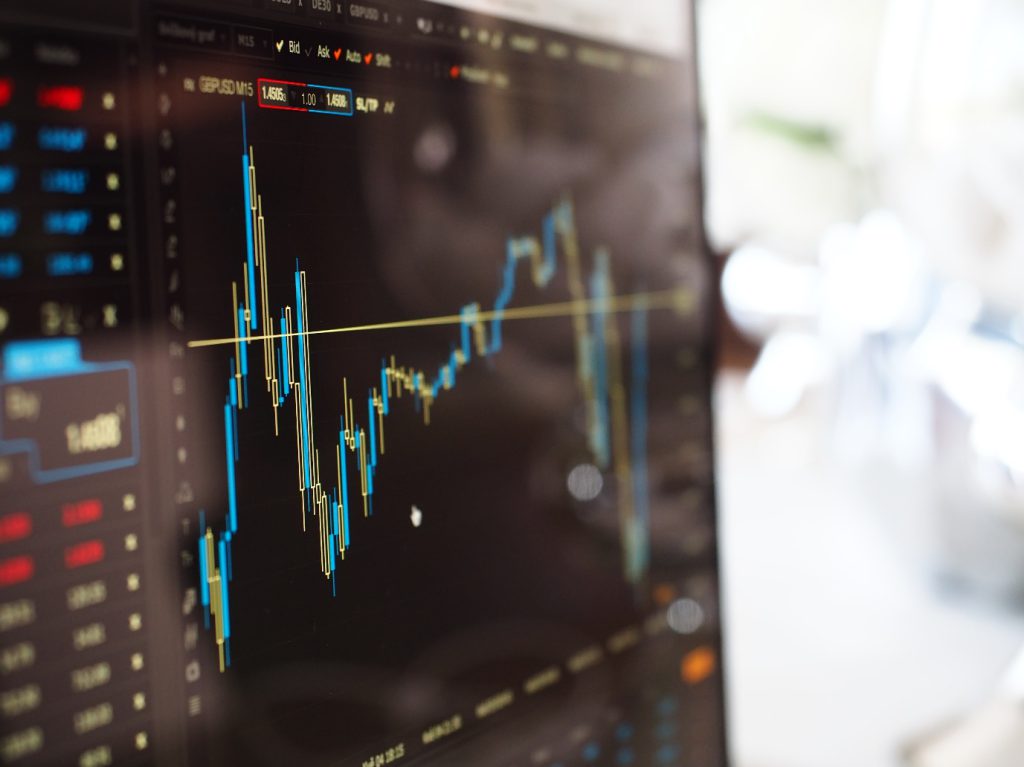
Forex charts are visual representations of price movements in the foreign exchange market. They provide traders with valuable information to analyze past price data and predict future market trends. These charts display different types of data, such as the opening and closing prices, highs and lows, and trading volume.
1.2 Why is Technical Analysis Important in Forex Trading?
Technical analysis plays a crucial role in forex trading as it helps traders make informed decisions based on historical price patterns. By studying chart patterns, trends, and indicators, traders can identify potential buying or selling opportunities. Technical analysis helps traders understand market sentiment, assess price levels, and set realistic profit targets and stop-loss orders.
2. Types of Forex Charts and their Components
2.1 Line Charts
Line charts are the simplest type of forex charts and are formed by connecting the closing prices of each period with a line. They provide a basic overview of price movements over time but lack detailed information such as highs, lows, or opening prices.
2.2 Bar Charts
Bar charts display more detailed information compared to line charts. Each bar represents a specific time period and contains four components: the opening price (left horizontal line), the closing price (right horizontal line), the high (top point), and the low (bottom point). Bar charts provide a visual representation of price ranges and volatility.
2.3 Candlestick Charts
Candlestick charts are widely used by forex traders due to their ability to provide comprehensive information in a visually appealing way. Each candlestick represents a specific time period and displays the opening, closing, high, and low prices. The “body” of the candlestick is filled or hollow, indicating whether prices have risen or fallen during the period.
2.4 Components of Forex Charts
Regardless of the chart type, forex charts consist of common components such as the X-axis (time) and Y-axis (price). Traders can adjust the timeframes according to their trading strategies, ranging from minutes to months or even years. Charting platforms also offer drawing tools, trendlines, and other indicators to enhance technical analysis.
3. Key Tools and Indicators for Technical Analysis
3.1 Moving Averages
Moving averages smooth out price fluctuations and help identify trends. They calculate the average price over a specified period and create a line on the chart. Traders use moving averages to identify potential support and resistance levels, as well as crossover signals that indicate changes in market direction.
3.2 Relative Strength Index (RSI)
The RSI is a momentum oscillator that measures the speed and change of price movements. It ranges from 0 to 100 and helps traders identify overbought or oversold conditions in the market. When the RSI reaches extreme levels, it suggests a potential reversal or correction in price.
3.3 Bollinger Bands
Bollinger Bands consist of a moving average and two standard deviation lines. They provide a visual representation of price volatility. When the price touches the upper band, it may indicate overbought conditions, while touching the lower band suggests oversold conditions. Traders use Bollinger Bands to identify potential breakouts or reversals.
3.4 Fibonacci Retracement
Fibonacci retracement levels help traders identify potential support and resistance levels based on the Fibonacci sequence. These levels indicate areas where the price might reverse or consolidate before continuing its trend. Traders often use Fibonacci retracement in conjunction with other technical analysis tools to confirm potential trade setups.
4. Understanding Chart Patterns and Trend Analysis
4.1 Common Chart Patterns
Chart patterns are formed by the price movements on the chart and often indicate potential future price movements. Common chart patterns include triangles, double tops and bottoms, head and shoulders, and flags. Traders use these patterns to anticipate breakouts, trend reversals, or continuation of existing trends.
4.2 Identifying Trend Lines
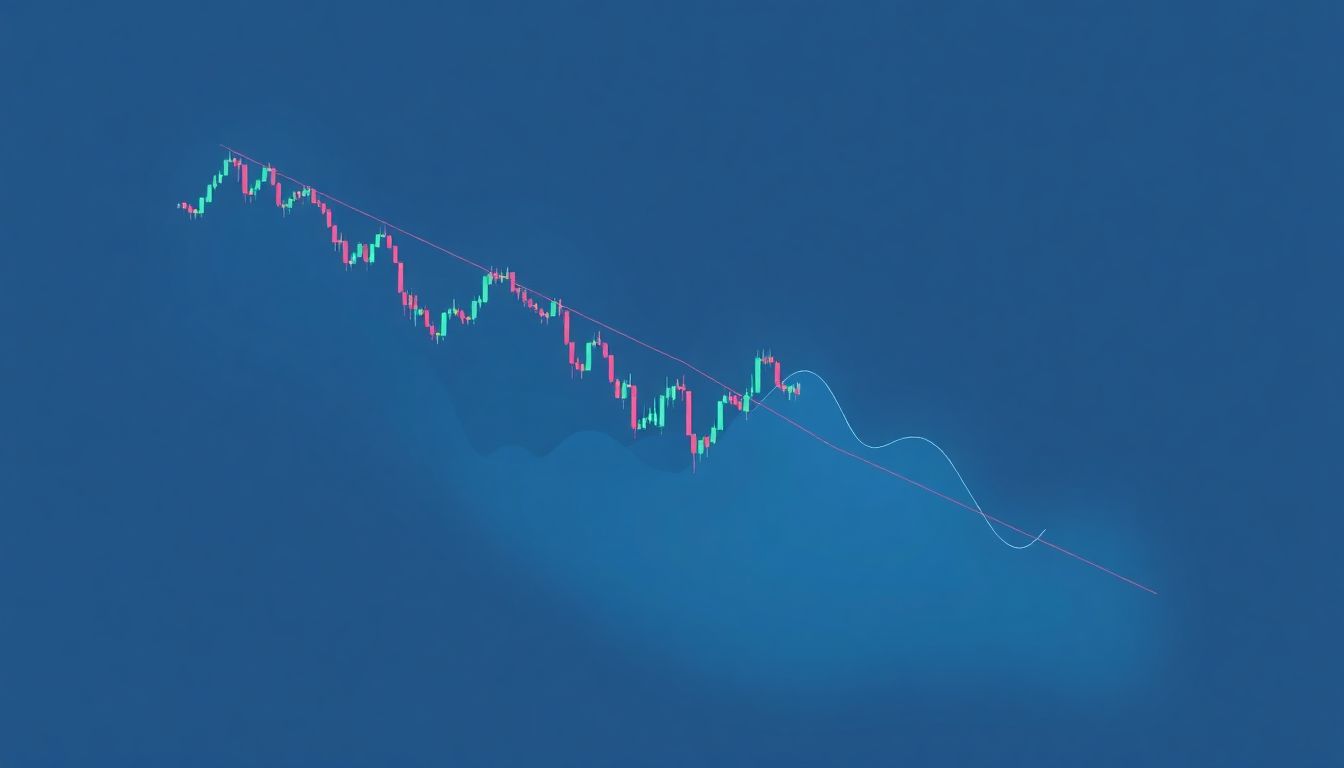
Trend lines are drawn on charts to identify the direction of the market trend. An uptrend is formed by connecting consecutive higher lows, while a downtrend is formed by connecting consecutive lower highs. Trend lines help traders determine the strength and reliability of a trend and can be used to identify potential trading opportunities.
4.3 Using Support and Resistance in Trend Analysis
Support and resistance levels are key areas on a chart where price tends to stall, reverse, or consolidate. Support levels act as a floor preventing further price declines, while resistance levels act as a ceiling preventing further price advances. By identifying these levels, traders can make more informed decisions about entry, exit, or stop-loss points in their trades.to Make Trading Decisions
8.3 Benefits and Limitations of Combining Technical and Fundamental Analysis
5. Support and Resistance Levels in Forex Trading
5.1 Definition and Importance of Support and Resistance
Support and resistance are like the yin and yang of Forex trading. They are key levels on a price chart that indicate where buyers and sellers are likely to step in or pull out. Support is a level where demand for an asset is strong enough to prevent prices from falling further. Resistance, on the other hand, is a level where selling pressure is strong enough to prevent prices from rising higher.
These levels are important because they can act as turning points for price movements. When an asset approaches a support level, it may bounce off and start moving upwards. Conversely, when an asset approaches a resistance level, it may retreat and start moving downwards. Understanding support and resistance can help traders identify potential entry and exit points in their trades.
5.2 Drawing Support and Resistance Lines
Drawing support and resistance lines on a chart is as simple as connecting the dots. Look for areas where price has repeatedly reversed or paused, creating a horizontal line connecting those points. The more times price has respected a level, the stronger it becomes.
Remember, support and resistance levels are not set in stone. They can change over time as market conditions evolve. So, it’s important to regularly review and adjust your support and resistance lines accordingly.
5.3 Applying Support and Resistance Levels in Trading
Once you have identified support and resistance levels on your chart, you can utilize them in your trading strategy. For example, if price is approaching a strong support level, you might consider buying or going long, anticipating a bounce. On the other hand, if price is nearing a resistance level, you may consider selling or going short, expecting a pullback.
Support and resistance levels can also be used to set stop-loss and take-profit levels. Placing your stop-loss just below a support level (in a long trade) or just above a resistance level (in a short trade) can help protect your capital if the price breaks through these levels.
Remember, though, that support and resistance levels are not foolproof. Sometimes, price may break through these levels, leading to false breakouts. It’s essential to combine support and resistance analysis with other indicators and tools to increase the probability of successful trades.
6. Utilizing Moving Averages and Oscillators for Analysis
6.1 Types of Moving Averages
Moving averages are like the cool kids of technical analysis. They smooth out price data to identify trends and provide more clarity to the noisy market. There are different types of moving averages, such as the simple moving average (SMA) and the exponential moving average (EMA).
The SMA gives equal weightage to all data points in the calculation, while the EMA gives more weightage to recent data, making it more responsive to current price movements. Both moving averages have their merits, and traders often experiment with different combinations to find what works best for them.
6.2 Moving Average Crossovers
Moving average crossovers are like the Romeo and Juliet of trading signals. When a shorter-term moving average crosses above a longer-term moving average, it suggests a potential uptrend. Conversely, when a shorter-term moving average crosses below a longer-term moving average, it indicates a potential downtrend.
These crossovers can be used to generate buy or sell signals. For example, a bullish crossover may prompt you to enter a long trade, while a bearish crossover may trigger a short trade. However, it’s important to confirm signals with other indicators and consider market conditions before making trading decisions.
6.3 Oscillators and Overbought/Oversold Conditions
Oscillators are like the mood rings of technical analysis. They help identify overbought and oversold conditions in the market, indicating potential reversals. Popular oscillators include the Relative Strength Index (RSI) and the Stochastic Oscillator.
When an oscillator reaches or exceeds a certain threshold, it suggests the market is overbought, meaning prices may soon reverse downwards. Conversely, when an oscillator drops below a certain threshold, it indicates the market is oversold, signaling a potential upward reversal.
Oscillators can be valuable tools for identifying entry and exit points, but like all indicators, they are not infallible. It’s essential to use them in conjunction with other analysis methods to increase the accuracy of your trading decisions.
7. Importance of Volume and Market Sentiment in Technical Analysis
7.1 Understanding Volume and its Significance
Volume is like the crowd at a music concert. It represents the number of shares or contracts traded in a particular asset over a given period. High volume indicates strong participation and interest, while low volume suggests a lack of enthusiasm or apathy.
Volume can provide valuable insights into market dynamics. For example, if prices are rising on high volume, it suggests a strong bullish sentiment. Conversely, if prices are falling on high volume, it indicates a strong bearish sentiment.
Analyzing volume patterns can help traders confirm or question the validity of price movements. If a price breakout occurs on low volume, it may be a false signal, whereas a breakout on high volume adds credibility to the move.
7.2 Analyzing Market Sentiment with Indicators
Market sentiment is like social media trends. It reflects the overall attitude and opinion of market participants towards a particular asset. Positive sentiment can drive prices higher, while negative sentiment can push prices lower.
Indicators like the put-call ratio, the volatility index (VIX), and sentiment surveys can help gauge market sentiment. For example, a high put-call ratio suggests bearish sentiment, as traders are buying more put options to hedge against potential price declines.
Understanding market sentiment can help traders assess the overall market mood and make more informed trading decisions. However, it’s important to remember that sentiment can change quickly, so it should be used in conjunction with other analysis techniques.
7.3 Combining Volume and Market Sentiment in Analysis
By combining volume and market sentiment analysis, traders can get a more comprehensive view of the market. When high volume accompanies positive sentiment, it may indicate a strong trend, increasing the likelihood of successful trades. Conversely, when high volume occurs alongside negative sentiment, it may signal a potential reversal or correction.
Combining volume and sentiment analysis can help traders confirm or question the strength of price movements. It can also assist in identifying potential areas of support and resistance, as high volume and extreme sentiment levels often coincide with significant turning points in the market.
Remember, though, that no single indicator or analysis method can guarantee trading success. It’s crucial to use a mix of tools and techniques, along with proper risk management, to make well-informed trading decisions.
8. Combining Technical and Fundamental Analysis in Forex Trading
8.1 Overview of Fundamental Analysis
Fundamental analysis is like the Sherlock Holmes of trading. It focuses on analyzing economic, politicalIn conclusion, understanding forex charts and mastering technical analysis is crucial for any trader looking to navigate the dynamic world of forex trading successfully. By utilizing various chart types, tools, and indicators, you can gain valuable insights into market trends, identify key support and resistance levels, and make informed trading decisions. Remember to combine technical analysis with fundamental analysis for a holistic approach to trading. By continuously honing your skills and staying updated with market developments, you can enhance your trading strategy and increase your chances of success in the forex market. Happy trading!
FAQ
1. Why is technical analysis important in forex trading?
Technical analysis is essential in forex trading as it allows traders to analyze historical price data, identify patterns, and make informed predictions about future price movements. By using technical analysis, traders can gain insights into market trends, potential entry and exit points, and manage risk effectively.
2. What are the key tools and indicators used in technical analysis?
There are several key tools and indicators used in technical analysis, including moving averages, trend lines, support and resistance levels, oscillators like the RSI and MACD, and chart patterns such as head and shoulders, triangles, and double tops/bottoms. These tools help traders identify potential buying and selling opportunities and gauge the strength of market trends.
3. Can technical analysis be used alone in forex trading?
While technical analysis is a powerful tool, it is important to note that it should not be used in isolation. Fundamental analysis, which involves analyzing economic indicators, news events, and geopolitical factors, is also crucial in forex trading. Combining both technical and fundamental analysis provides traders with a more comprehensive understanding of the market and can lead to better trading decisions.
4. How can I improve my technical analysis skills?
Improving your technical analysis skills requires practice, continuous learning, and staying updated with market developments. Start by understanding the basics of chart patterns, indicators, and tools. Experiment with different strategies and techniques on demo accounts before implementing them in live trading. Additionally, reading books, attending webinars, and following reputable analysts can provide valuable insights and help enhance your technical analysis skills over time.


Facebook Comments